To systematically document neighbourhood rhythms, a participatory data collection process was established between April and June in the form of Neighbourhood Rhythm Sessions. These sessions took place at various locations within the research area, mainly at community spaces and social organisations previously involved in the ethnographic trajectory. During the sessions, residents filled out a series of predefined forms, in which they described their daily, weekly, and yearly activities, as well as the places they regularly visited. In this way, rhythm-analytical data were collected that are both temporal and spatial in nature.
The data collection process consisted of three successive phases:
- Network building and planning, in which suitable locations and times for the sessions were identified;
- Implementation of the sessions, in which data were collected together with residents;
- Digitisation and methodological development, in which the results were processed and prepared for analysis.
The sessions took place at multiple community locations in various forms: through joining an activity, before or after an activity, organising special data-gathering sessions, distributing forms during an activity, unplanned sessions between activities, and one-to-one meetings.
Figure 1 illustrates the evolution of the session arrangement throughout the research trajectory. The first sessions took place in the first two weeks of April and were organised around existing activities at De Evenaar. In the second half of April, sessions were organised as stand-alone gatherings at various locations in the neighbourhood. Subsequently, the ethnographic trajectory was further deepened, which made it possible to organise additional rhythm sessions during various neighbourhood activities. In the final phase of the trajectory, a more target-group-oriented approach was adopted, with forms also being actively distributed among specific groups of residents.
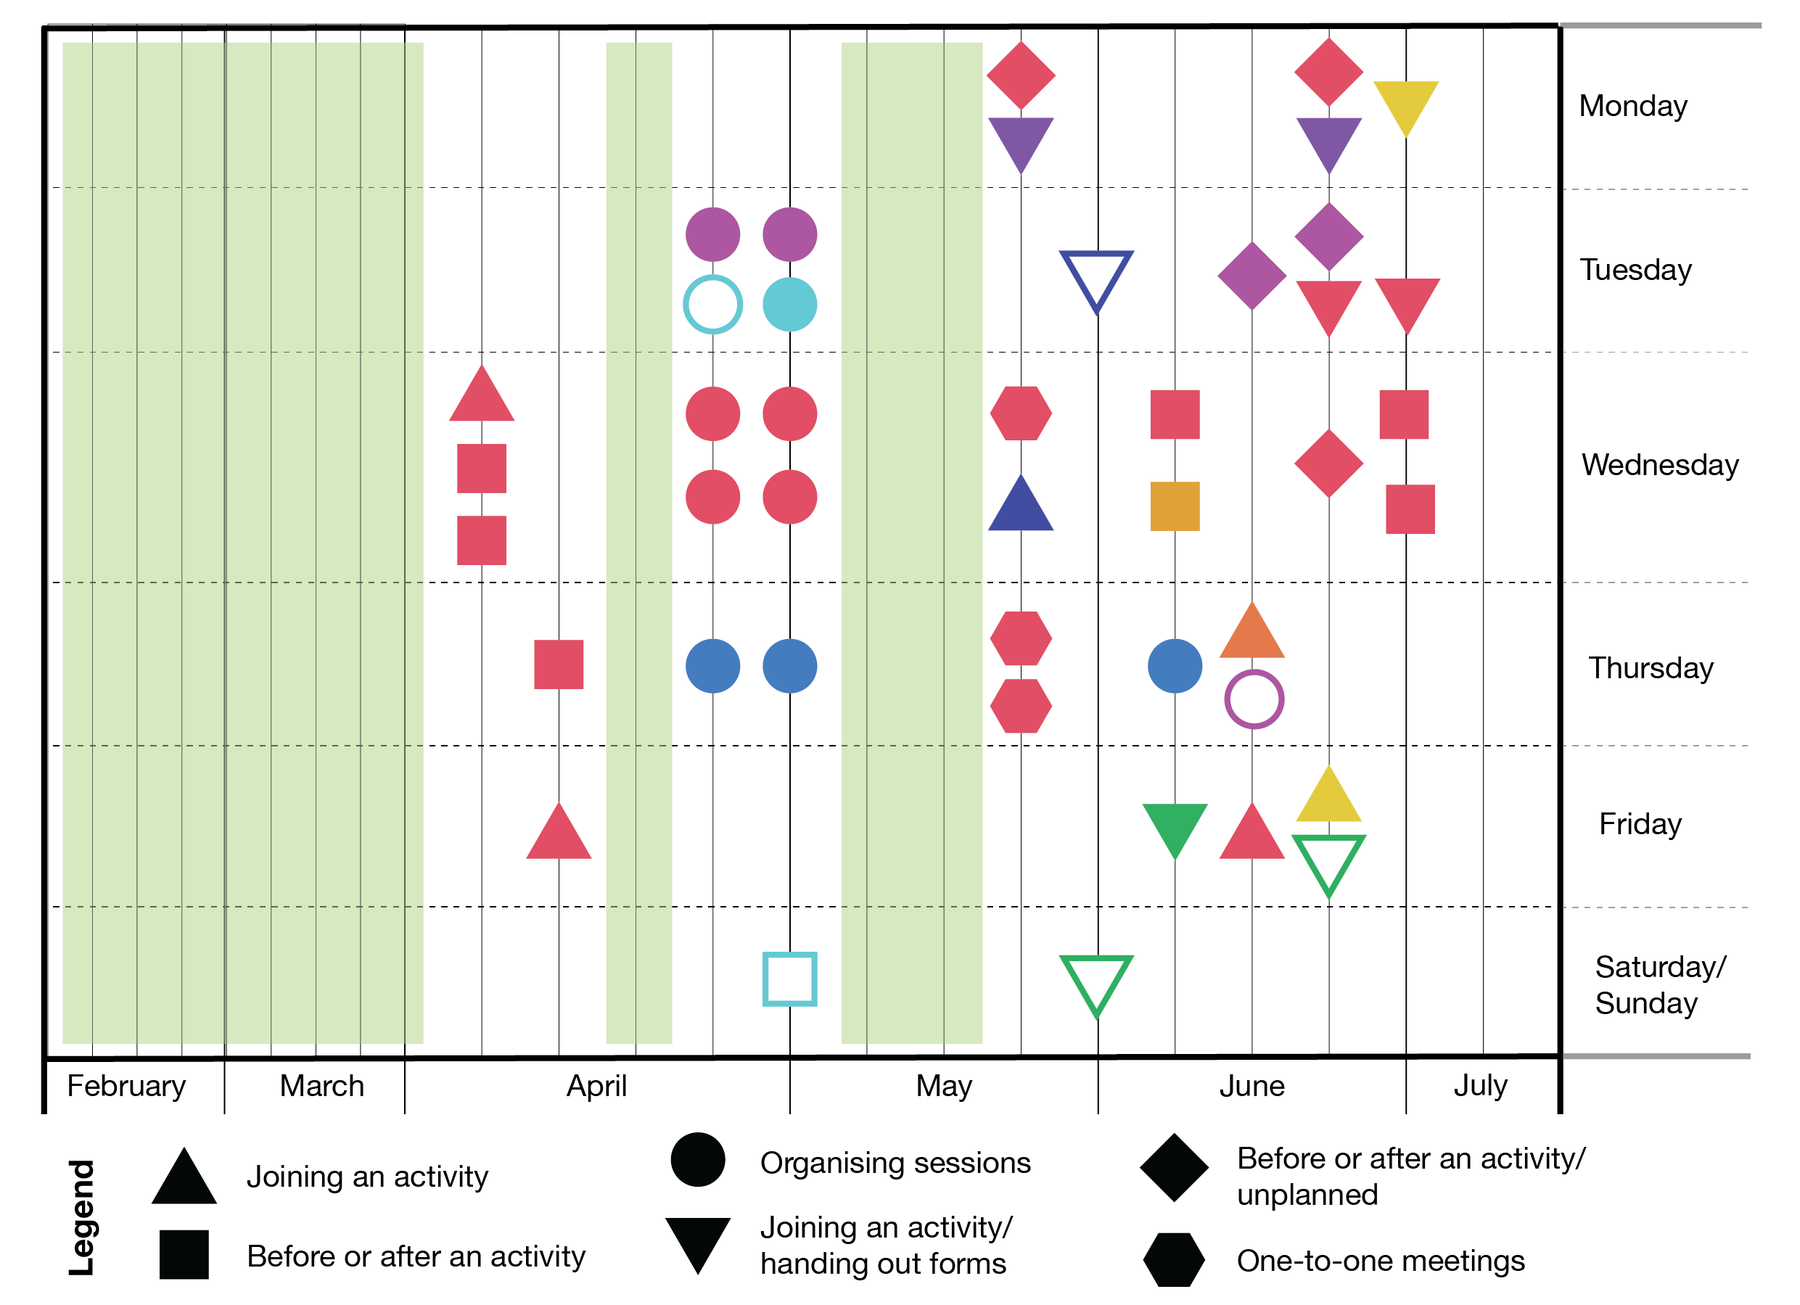
Figure 1: Process diagram of the data gathering trajectory
Thanks to this approach, data were collected from 140 residents of varying ages, household compositions, and lengths of residence in Tuindorp Oostzaan and the surrounding neighbourhoods. This has resulted in a broadly supported and representative picture of the social rhythms that shape the everyday functioning of the neighbourhood.
The Collected Data
The collected data consists of granular spatio-temporal information about the daily lives of residents from Tuindorp Oostzaan and the surrounding neighbourhoods. This information is structured across three temporal scales:
Daily rhythms: On this temporal scale, the data provide insights into what a typical day looks like for each participating resident. It records whether they are at home, in the neighbourhood, or elsewhere in the city while carrying out their daily activities. Participants receive a 24-hour diagram in which they can fill in this information.
Weekly rhythms: This scale enables the visualisation of residents’ weekly activities. For this, participants complete a weekly schedule divided into the seven days of the week and three parts of the day (morning, afternoon, evening). For each activity, they note the type of activity, the location, and the specific time. Documented activities include work, taking children to school, hobbies, or everyday tasks such as grocery shopping. The collected spatio-temporal data provide insights into which activities residents engage in, how often they occur, at what times, and in which locations.
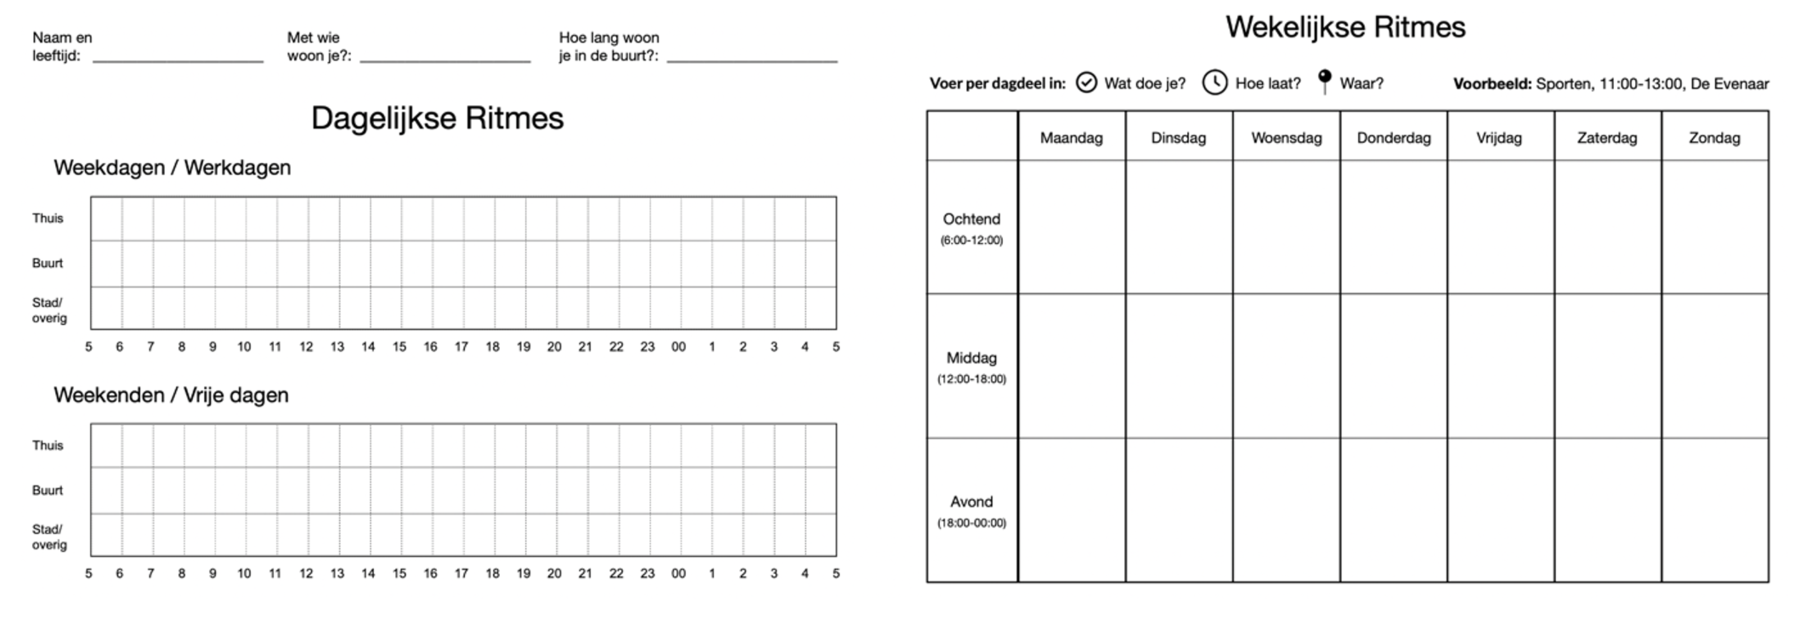
Figure 2: Charts for documenting daily and weekly rhythms
Yearly rhythms: On this temporal scale, residents indicate which important moments recur on a seasonal or yearly basis. For this, participants receive a circular year calendar with twelve months, in which they fill in their annual activities. These include cultural celebrations, neighbourhood events, moments of engagement with nature and ecology, and personal occasions such as vacations. They also specify where these activities take place and during which period of the year.
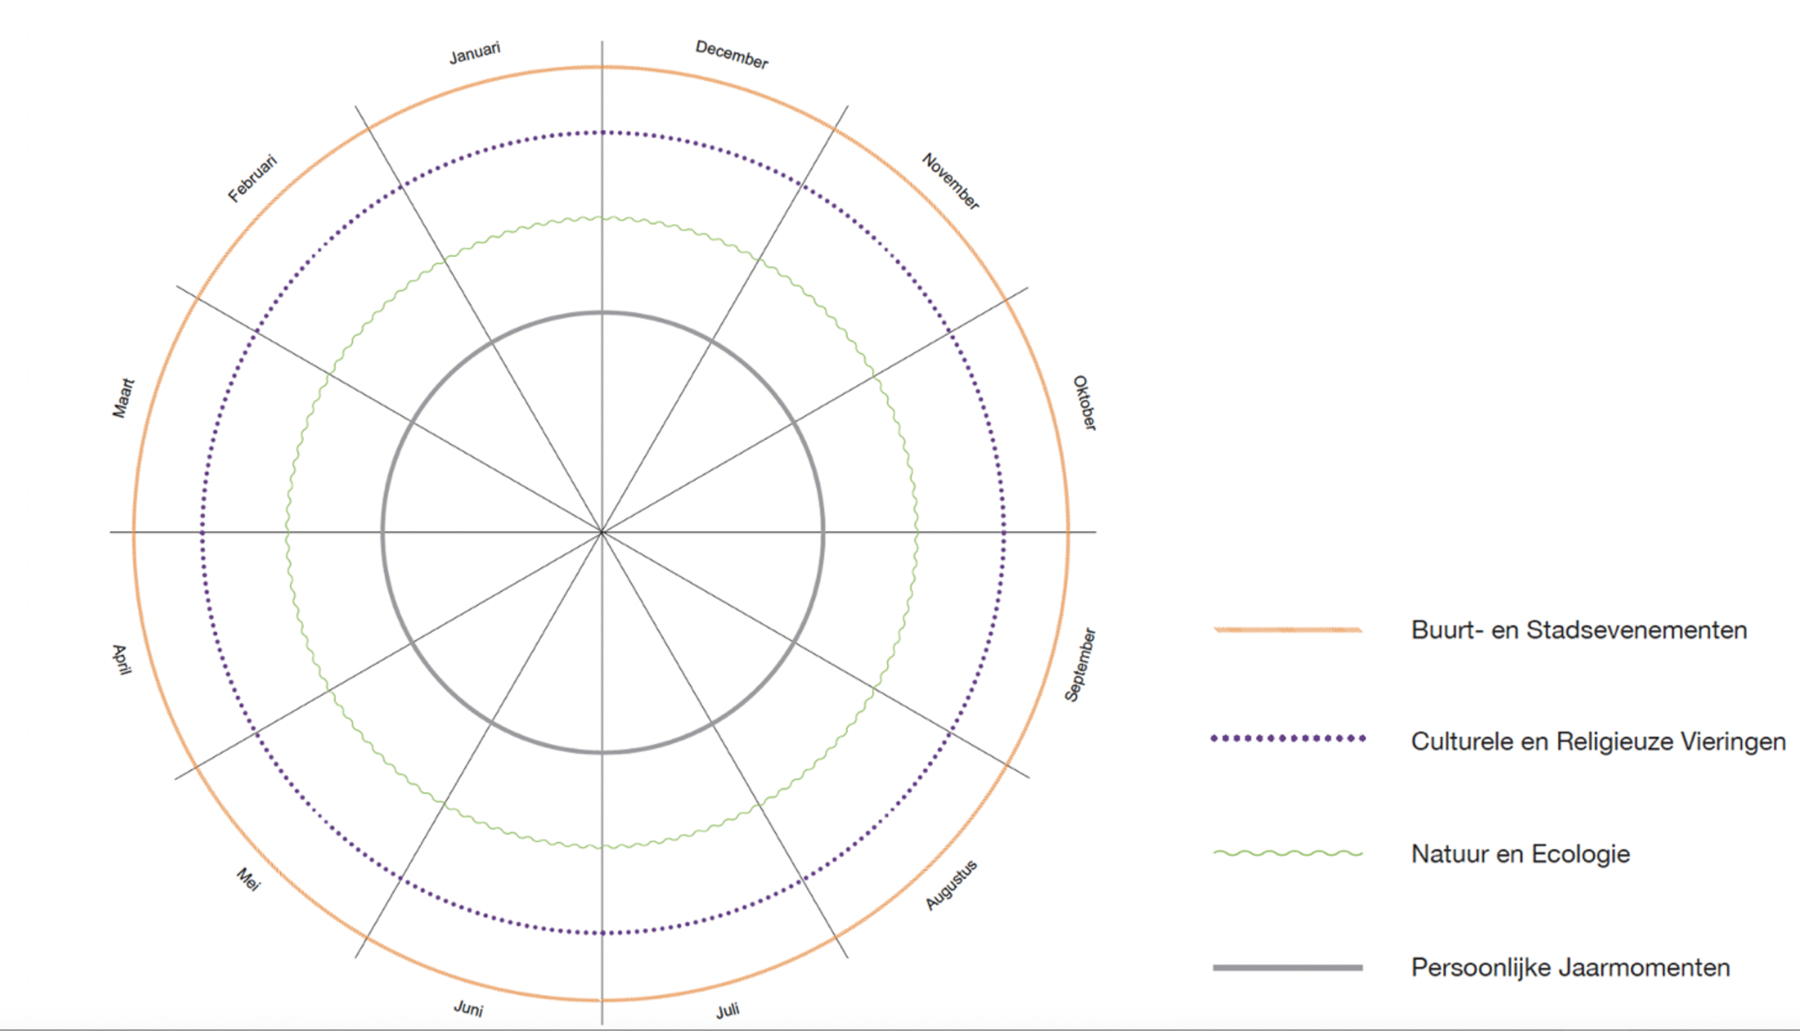
Figure 3: Visual chart for documenting yearly rhythms
Patterns of spatial use: In addition to the temporal data, the research also focuses on mapping important places in and around the neighbourhood. Residents are asked to indicate the locations they visit weekly or monthly, even if these do not occur at fixed times, as in the weekly rhythm registration. Using a legend, residents mark on a map which places they visit for groceries, cultural activities, hobbies, sports, religion, and health.
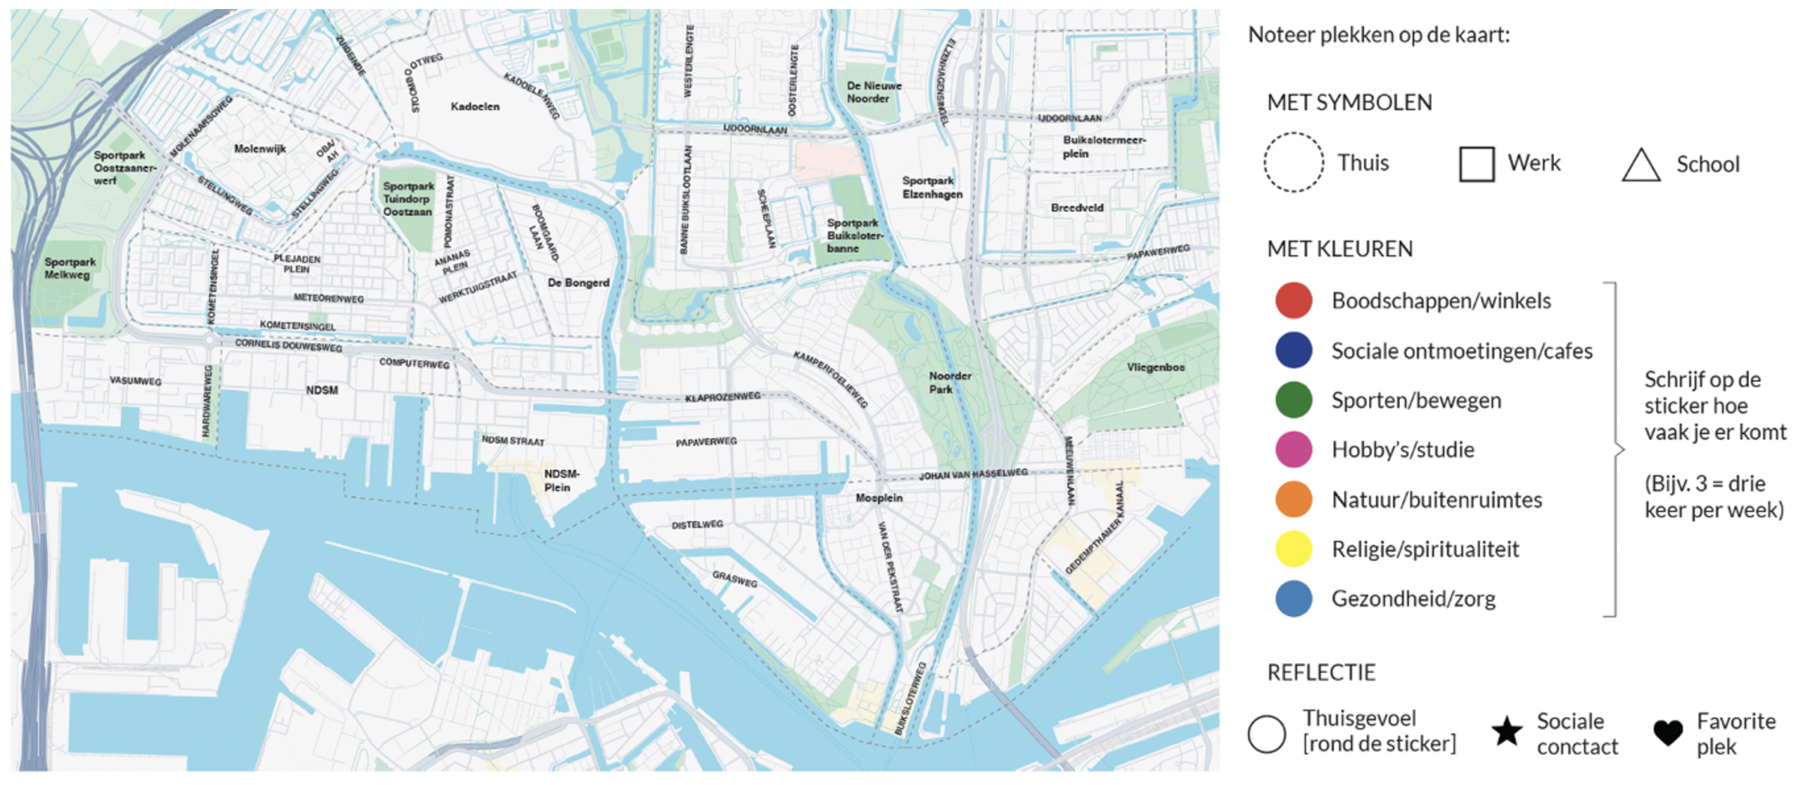
Figure 4: Map and legend for documenting the spatial patterns
Together, these data provide a coherent overview of a resident’s rhythm, made visible in space and time. By analysing the combined data from all participating residents, the research maps the broader rhythms present in Tuindorp. These insights offer valuable input for designers and policymakers, facilitating a deeper understanding of the lived experiences of residents and communities. In doing so, development and spatial interventions in the urban context can be more closely aligned with the actual tempo of neighbourhood life.